
Problem & audience
Plant directors and the maintenance, production, quality and energy teams.
- Machine data and shift reports are out of sync; downtime root causes are hard to trace.
- Reactive maintenance after failures causes disruption and is hard to plan.
- Energy use and quality defects are not tied to individual lines or batches.
Solution modules
Monitoring & OEE
Tracks machine state, output, downtime and reasons; computes OEE by the definition the plant approves.
Condition-based maintenance
Analyses vibration, temperature and failure history; flags anomalies and raises inspection requests.
Quality & safety
Connects quality checks via data/cameras at suitable points; operators verify alerts.
Energy & dashboards
Tracks power by equipment, shift or product; reports trends and abnormal consumption points.
Process & data
Data to prepare
- Asset register, OT network diagram and existing device protocols.
- Shift data, good/defective output, downtime and maintenance history.
- Energy norms, metering diagram and system access rules.
Deliverables
- Site survey, measurement-point catalogue and OT/IT connection architecture.
- Gateway, dashboards and alert set within the pilot equipment scope.
- Connection-loss test suite, operating guide and system maintenance schedule.
- Case study with screenshots, a workspace and sample apps for three roles; module/permission matrix and handover flow.
Delivery conditions
The customer names a process owner, provides data cleared for use and a systems contact. CTC Smart Tech and the business team agree scope, test set, change handling and operating responsibility.
Infrastructure, equipment, licences, third-party integration and AI running costs are determined separately by discovery. This document is not a quotation or SLA commitment.
Pilot & acceptance criteria
- Choose one line or equipment group and survey the measurement points.
- Connect read-only, check data quality and time sync.
- Build dashboards and tune thresholds with operations staff.
- Cross-check on site; accept and plan the roll-out.
| Metric | How it is measured |
|---|---|
| Data coverage | Share of active measurement points and valid records versus expected. |
| OEE | Availability × Performance × Quality; recording method agreed before the pilot. |
| Useful alerts | Share of alerts verified as correct; time from detection to handling. |
| Energy | kWh per product unit, compared within the same product and operating conditions. |
Fix the pass threshold, sample size and measurement period before the pilot. These metrics are a proposed evaluation frame, not actual results or a performance commitment.
Governance & control
- Early phases favour read-only connections, OT/IT network separation and role-based accounts.
- Internet loss requires an edge buffer; retention time and sync mechanism are part of acceptance.
- Forecast models need quality history; no lead-time commitments before measurement.
Apply least privilege, data separation, action logs, retention/deletion rules and recovery. Test wrong-permission access, missing data and service interruption before handover.
Industrial IoT · Plant Operations
A design case study based on the Industrial IoT and CPSmart profile: monitoring measurement points, verifying alerts, assigning maintenance and closing the loop.
IoT/CPSmart capability documentation exists; the dashboards, assistant and apps in this kit are design prototypes not connected to real equipment.
Sample UIs use synthetic data. Existing DocAgent screenshots have record/partner/figure data redacted. No real customer or employee results are used for illustration.
Collect
Log timestamp, equipment, measurement point and signal quality.
Verify
Operations receives the alert and checks data reliability.
Assign
Create an inspection request for the right technician.
Maintain
Record the checklist, on-site result and evidence of work.
Close the loop
The manager checks the result before closing the alert.
See where the work gets done.
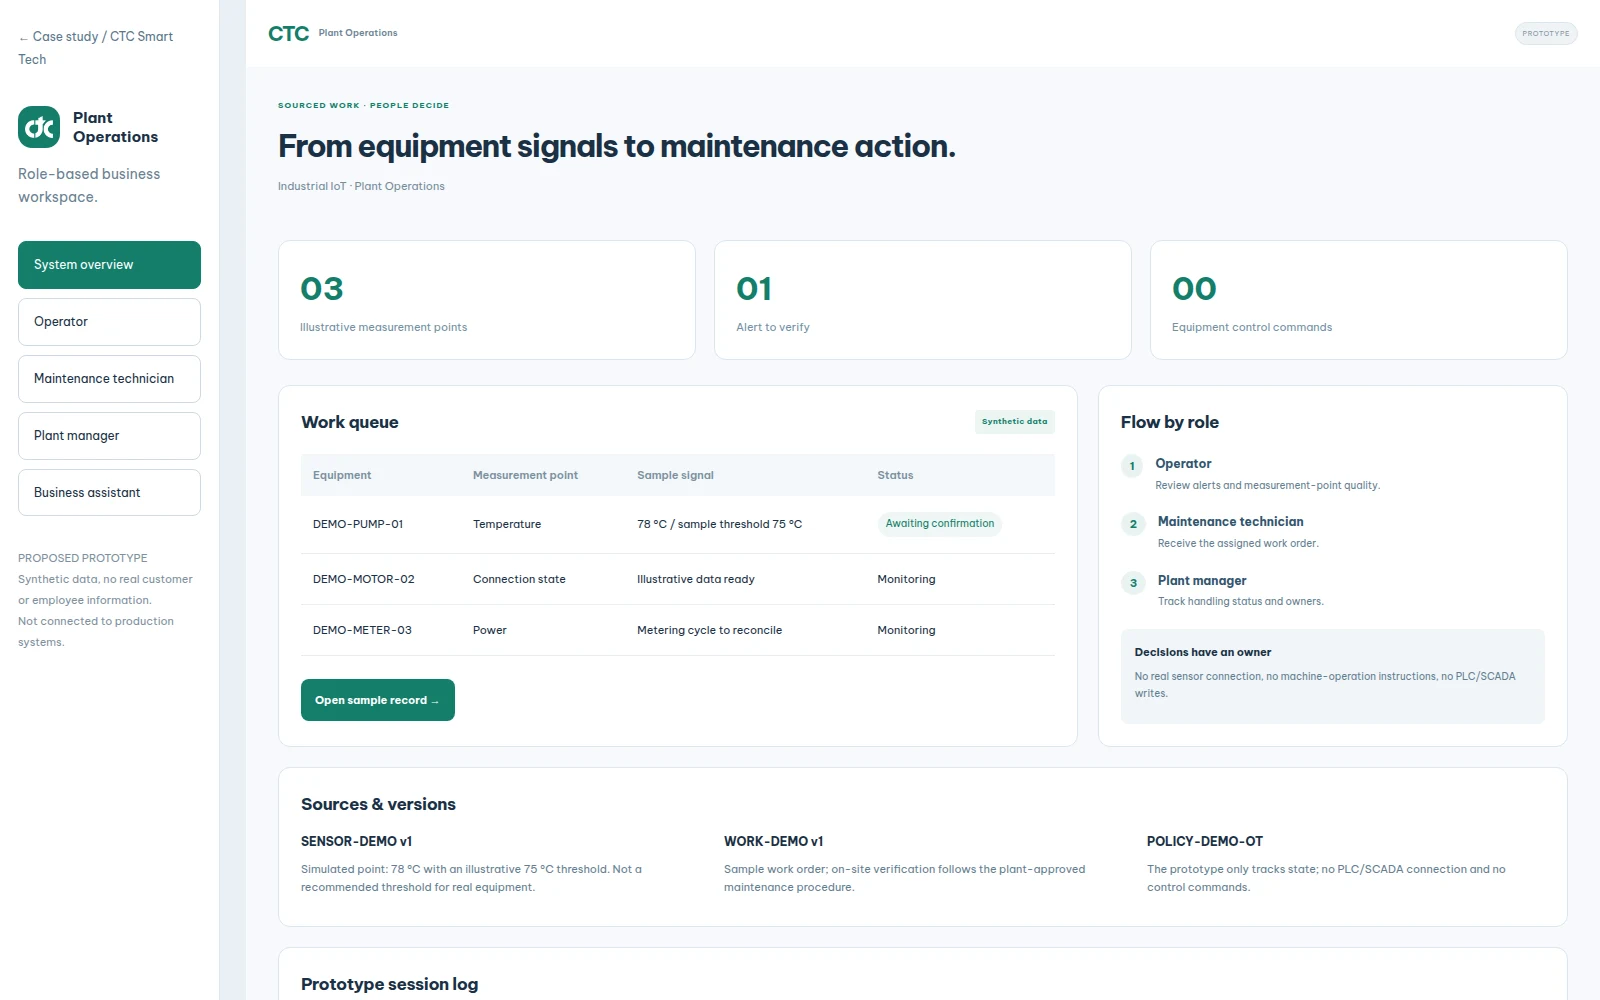
Plant Operations workspace
Prototype dashboard with simulated records; states and process follow the solution design.
Open the sample UI ↗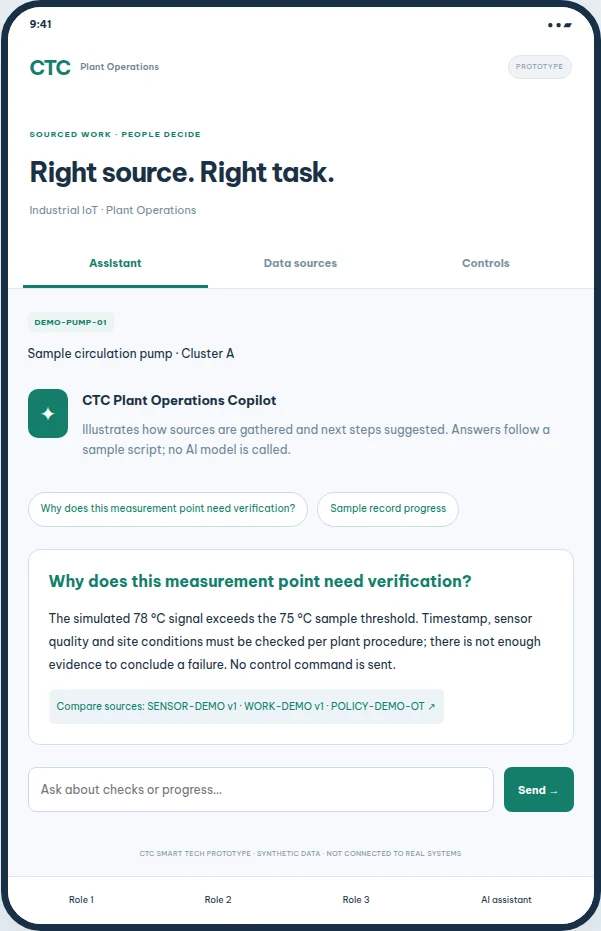
Plant Operations assistant
Why does this measurement point need verification? Sourced simulated scenario; no LLM call.
Open the sample UI ↗Every role has a clear workflow.
The apps focus on frequent tasks. In production they share the APIs, file codes, permission policy and history of the business platform.
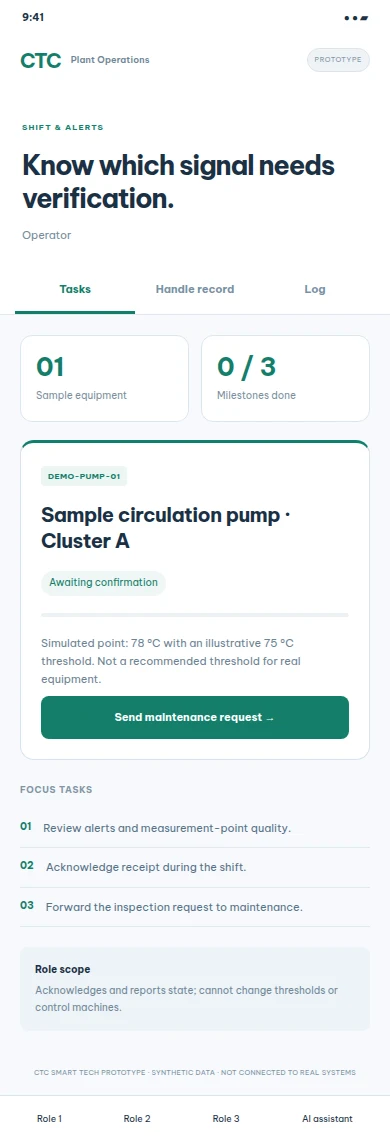 SHIFT & ALERTS
Operator
- Review alerts and measurement-point quality.
- Acknowledge receipt during the shift.
- Forward the inspection request to maintenance.
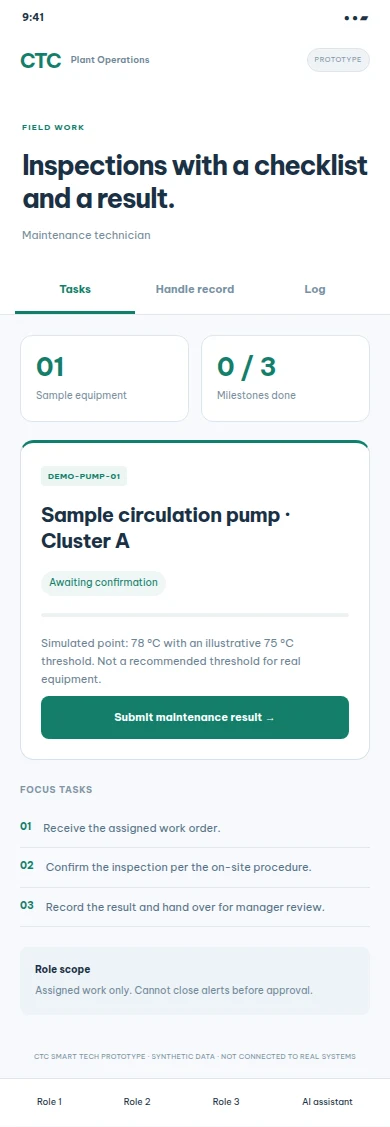 FIELD WORK
Maintenance technician
- Receive the assigned work order.
- Confirm the inspection per the on-site procedure.
- Record the result and hand over for manager review.
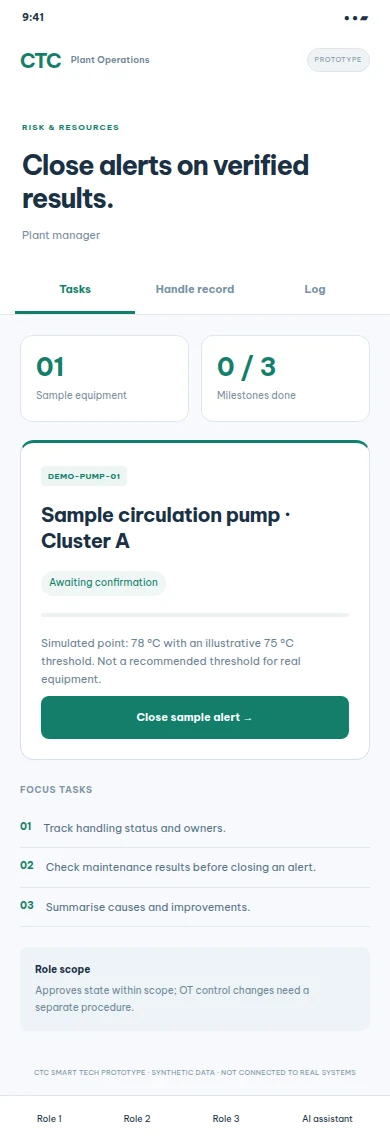 RISK & RESOURCES
Plant manager
- Track handling status and owners.
- Check maintenance results before closing an alert.
- Summarise causes and improvements.
Module mapping & permission limits
| Role | Module | Scope |
|---|---|---|
| Operator | Monitoring → Alerts → Maintenance request | Acknowledges and reports state; cannot change thresholds or control machines. |
| Maintenance technician | Work order → Checklist → Inspection result | Assigned work only. Cannot close alerts before approval. |
| Plant manager | Dashboard → Maintenance → Close approval → Audit log | Approves state within scope; OT control changes need a separate procedure. |
From input to an evidence-based decision.
The first role completes the checklist and submits evidence; the next role records an evidence-based result; the approver confirms or returns with a reason. The sample session logs every step.
No real sensor connection, no machine-operation instructions, no PLC/SCADA writes.
Sample state is stored in the same browser, separated per solution. There is no authentication, multi-user backend, cross-device sync, push or LLM connection. Those must be built and accepted before real operation.
Sources to compare, not automatic conclusions.
SENSOR-DEMO v1
Simulated point: 78 °C with an illustrative 75 °C threshold. Not a recommended threshold for real equipment.
WORK-DEMO v1
Sample work order; on-site verification follows the plant-approved maintenance procedure.
POLICY-DEMO-OT
The prototype only tracks state; no PLC/SCADA connection and no control commands.
The simulated 78 °C signal exceeds the 75 °C sample threshold. Timestamp, sensor quality and site conditions must be checked per plant procedure; there is not enough evidence to conclude a failure. No control command is sent.
DEMO sources are synthetic data for simulation. Real business documents must be collected with usage rights, versioned and quality-checked.
Pilot & acceptance roadmap
- Survey measurement points, protocols and the OT/IT boundary.
- Connect read-only; check timestamps, missing data and buffering.
- Run trial alerts; cross-check with operations/maintenance.
- Accept the confirm–handle–close loop and recovery capability.
Conditions to verify
- Alerts store source, time and measurement-point quality.
- No closing without an inspection result.
- Delayed / disconnected data shows the correct state.
- The monitoring flow never generates control commands.
Agree scope, baseline, sample size, confirming person and operating responsibility before the pilot. Demos do not replace acceptance results or performance commitments.
Reference direction: CTC Smart Tech Industrial IoT & CPSmart capability profile. Details are compiled from existing documents and source code; new UIs are clearly marked as proposed designs.
Frequently asked questions
Do we need to replace all machinery?
We first survey what existing PLC/SCADA can expose; sensors are only added where points are missing.
How soon do we get predictive maintenance?
It depends on data quality and failure history. Start with alert thresholds, then upgrade once enough data has accumulated.
Reference: CTC Smart Tech Industrial IoT & CPSmart capability profile. IoT/CPSmart capability documentation exists; the dashboards, assistant and apps in this kit are design prototypes not yet connected to real equipment. The process, pilot and acceptance sections in this kit are proposed designs to be confirmed per project.